Glossary/Reading Player Cards
The player cards are broken down into different parent categories to make them less overwhelming on the eyes (I know the last thing I want to see is a wall of bar charts that I can’t decipher). There is a lot of data that goes into these charts & it’s very tough to break things down into one number. What we can do instead is separate them into different categories to get a gauge of which skills each player excels at and where they struggle. How much offense do they create? Are they creating quality scoring chances? Are they creating thorough shooting or passing? What’s their role their line? Are they good at defending the blue line or are they better at moving the puck out of the zone?
These are all things that we can dive into with these charts.
The Categories
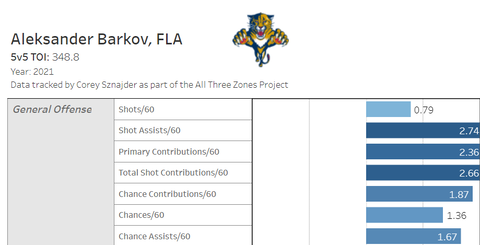
General Offense:
This is the most basic section of the viz, as it only shows shots & shot assists. Shot assists are like regular assists but applied to all shots instead of just goals. This serves as a proxy for how much overall offense a player is responsible for & the Primary Contribution section shows how much the player is directly created, as it only counts shots & primary assists. Primary Contributions are more valuable than Total Contributions, but they usually line up with each other.
The next part is the same but with scoring chances. How I track scoring chances is any shot that comes within the “home plate” area of the offensive zone between the two faceoff circles. Although I do make exceptions for certain shots (flubs, pucks that roll in on the goaltender, mishits, blocked shots, etc.). It’s subjective, but it’s one area of context that I like do add when I do my tracking since I’m reviewing individual games.
Pass Types
We know that shots preceded by a pass are more likely to lead to goals, but the quality of pass can also be measured thanks to the foundational work done by Ryan Stimson. First part is looking at point shot setups, or “low-to-high” passes as they’re tracked. These are the lowest quality shots of the bunch, as shots from the point have a very low chance at leading to a goal. Players who create these shots are considered more possession drivers than playmakers, as they’re creating offense in terms of shot volume but not many direct quality chances. There is value for players like this, especially if you have a line that struggles to keep play in the offensive zone or have a system that excels in puck retrievals or shooting for deflections, but these are still the lowest quality passes in terms of driving shot quality.
Next are assists from the center lane, which drive shooting percentage a little higher than shot assists from the boards or outside the dots. Finally, we have “high danger shot assists” which are passes from behind the net (or the goal line) or passes that cross the slot from the faceoff circles down. These passes are the highest driver of shooting percentage & the most valuable pass types in the dataset.
Offense/Shot Types
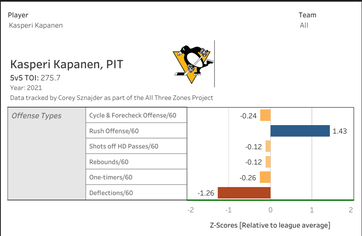
This category looks at the context behind where players create their offense. First two sections look at if they’re creating off the rush, which are shots that happen immediately after a controlled zone entry, and shots that come off a sustained possession in the offensive zone. Faceoff plays are tracked in a separate category. The major difference with rush offense & the forecheck is that there are fewer shots off the rush in a game, but the players who are good in this area create more dangerous offense at the expense of possession or defensive play. More offense occurs off the forecheck, so this shows players who are good at creating sustained possessions. Both types of offense yield roughly the same number of goals & chances, but rush offense converts at a higher rate due to there being fewer shots per game. It’s one way to showcase players who can break the game open on one shift despite struggling in other areas.
The final four categories go over higher shot quality types (rebounds, deflections, one-timers & high danger plays). Basically a more in-depth version of scoring chances to show where players are creating most of their high danger opportunities.
Zone Entries/Transition
Zone Entries/Transition
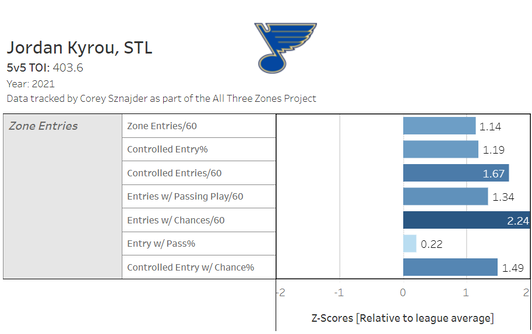
One of the more complicated categories is zone entries, which have a couple different layers. The first of which is how often each player enters the zone per game. It’s not the most important stat, but it gives you an idea of their workload or how much their linemates defer to him when entering the zone. The second is how often they enter the zone with control of the puck, this can be by skating over the line or passing to a teammate at the blue line (passer always gets credit unless the recipient has to beat a defender to enter the zone).
Controlled entries lead to more shots than dumping the puck in, so this is a big factor in how much offense teams create during the run of play. Next is how often they make a passing play that leads to a shot after gaining the line. This is important because passing plays off controlled entries lead to higher percentage shots than those without a pass. These are shown by percentage & entries per 60 to separate workload from efficiency. Lastly, we have entries that lead to scoring chances, which is the most important stat of the bunch. This is a newer stat that I started tracking in 2021 as a way to weed out players who are creating entries that don’t lead to anything substantial. The old standard was that controlled entries are good regardless, but as the league gets more skilled & strategies change, more context was added to show which players are getting results instead of producing empty calorie stats.
This section serves as a proxy for how well each player is at creating through the neutral zone & making a difference during the run of play when things are more open. Some of the best players in the league (your McDavids, Matthews, Mackinnons of the world) are usually at the top of the list in these stats but you also have some others such as Ryan O’Reilly and Patrice Bergeron who create most of their offense off forechecks/cycles.
Defense
While I don’t track super detailed stats like stick checks, pass breakups, there are some off-puck events that I track to add context to zone entries/exits that can be applied to defense. Even if it’s not necessarily the most traditional method.
Forechecking
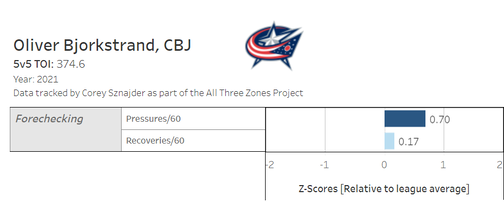
The first off-puck events tracked relate to the forecheck. Starting with Forecheck Pressures & Exit Disruptions, which are how often a forechecking player forces the player exiting the zone to make a play with the puck. All pressures are counted as such & disruptions are credited when the forechecking player forces an uncontrolled exit (clears, turnovers, missed pass, icing etc.). These are shown because forcing turnovers or a failed exit is shown to lead to goals & chances, while forcing bad exits gives the defending team a higher chance of recovering the puck & attacking.
The next category are dump-in recoveries, which are tracked when the team dumping the puck in recovers the puck & makes a play with it. In other words, they have to do something substantial with the puck once recovering it to get a credit for it. This is more to apply context to forwards who contribute on the forecheck while not creating many shots or chances (think Zach Aston-Reese, Matt Martin or Marcus Foligno).
Zone Entry Defense
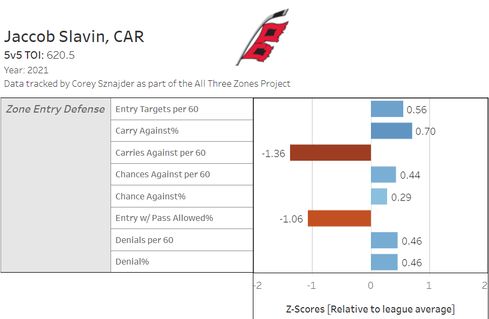
Entry defense is the flip-side of zone entry tracking, where we look at how good defensemen are at defending the rush. Entry defense is tracked the same as entries (controlled entry vs. chances allowed), but an additional category is added for entry denial, which are counted as failed entries from the attacking player’s perspective. This measures both player tendencies & how effective they are at keeping attacking players to the outside when they enter the zone.
This is one of the more nuanced stats because some systems have their defensemen back off & protect the middle of the ice instead of having them challenge forwards at the blue line. This is why I prefer looking at chances allowed as a proxy as opposed to the other stats because we’re looking for results at the end. However, it’s important to look at how each player defends the line because it shows how different each defensemen does their job. Jaccob Slavin, for instance, is very aggressive at the blue line, gets targeted a lot & gives up a lot of entries per game. However, he is one of the better defensemen in the league at preventing chances despite this.
This isn’t perfect, as the targeting player is sometimes not at fault for allowing a chance due to poor communication from his partner or just bad team defense in general. However, this does show you what happens on the ice & gives you a look into the “why” behind some players defensive metrics.
Zone Exits/Retrievals
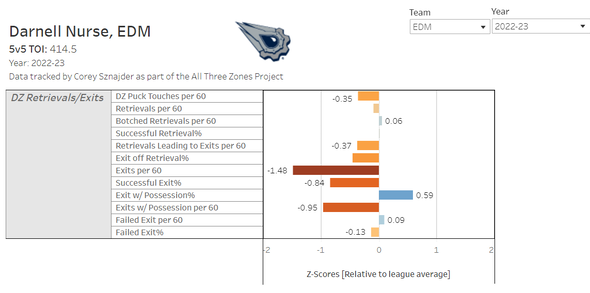
This is the newest & most complicated part of the dataset. I changed my zone exit tracking at the start of the 2021-22 season to be more focused on puck retrievals because I was charting a lot of noise with just zone exits alone. Most teams these days just want to get the puck out of the zone & are only setting up controlled exits when there is no pressure, data which is already tracked in the shots/transition data, so I wanted to shift zone exits to be more focused on where the exit begins rather than who got the puck out of the zone, because beating a forecheck & avoiding turnovers is an undervalued skillset with defensemen & could show some context why certain defensemen get results.
The tracking happens in a few stages, the first one being the puck retrieval, which is when the defending player skates back to retrieve a dump-in or a loose puck to start an exit. I track whether they cleanly retrieve the puck or turn it over (botched retrieval). From then, they can move the puck to a teammate within the zone or make an exit attempt themselves. These are categorized by exits with possession (passes or carries), exits without possession (clears, missed passes) and failed exits (turnovers, clears that the other team intercepts, icings). The player who retrieved the puck as well as the player who made the zone exit are given credit for these plays.
After that, we can develop some stats looking at how often each defenseman is at facilitating zone exits, one of which is “retrievals leading to exits” which are how often a defenseman’s successful retrieval leads to a successful exit (an exit with possession or a clear that the forechecking team doesn’t retrieve). Basically a way to show how good each defenseman is at evading pressure to solve problems with the puck, even if they aren’t the players exiting the zone. The start of the zone exit, if you will.
There is a lot of extra data in this that I haven’t shared yet either, but it’s something I’m going to be doing more studies on after the season is over.
Zone Exit Glossary
DZ Puck Touches: Anytime a player touches the puck in the defensive zone in an attempt to exit the zone or lead a breakout. Successful exits, clears, exchanges to teammates are counted in this. Used as a proxy to measure workload in the defensive zone. Exits are only counted if there is pressure from at least two players on the forecheck. Ex: Exits off dump-and-changes are not counted if the attacking team does not apply pressure.
DZ Retrievals: Anytime a player successfully retrieves the puck in the defensive zone when the opposing team dumps the puck in or loses possession on a shot attempt. Clears from the center of the ice are not counted in this. Puck must be cleanly retrieved & either moved to a teammate or out of the defensive zone to count. Turnovers are counted as "botched retrievals."
Exits: Whenever the defending player exits the zone successfully, this includes clears out of the zone that are not recovered by the forechecking team.
Exits With Possession: When the defending player exits the zone by skating the puck out or passing to a teammate. Exit must lead to a zone entry attempt or a successful line change to count.
Failed Exit: When the defending player turns the puck over directly to the opposing team within the zone, fails to clear the zone or clears the zone but gives possession to the forechecking team before getting to the red line. Missed passes or pucks that clear the blue line are counted as "missed exits" and in a separate category.
The Scale:
The charts are currently displayed by z-scores, which shows how the player rates relative to the league average. Forwards & defensemen are graded separately (obviously). It’s not perfect or my preferred method, but it’s an easy way to get everyone on an even playing field with so many different categories. A Z-score of 0 means a player is average in a certain category, while a higher z-score indicates that he is above average & vice versa for a negative z-score. Also worth noting that the distribution of data isn’t the same across all categories, so the shade of red/blue also gives an indication of where each player stands compared to the rest of the league.
I recommend using these charts in combination with the team-level charts on my Tableau, as those give you a better idea of how each player ranks in context with the rest of the team. For example. A player like Teuvo Teravainen or Jason Robertson have excellent stats across the board, but grade very weak in transition because they play on teams that prefer to dump the puck in on most of their zone entries. On the flipside, a player like Ryan Lomberg grades well in zone entries while playing in Florida, where most of their forward corps are above the league average in this category.
These charts aren’t meant to be the end-all-be-all to player analysis. However, they do give us a glimpse into what players do well and how they might fit on certain lines or teams. Both of which are very important to consider during free agency and trade season. The cards will give subscribers a quick glance at how each player grades out in terms of microstats & are an excellent starting point for deeper analysis.
Sharing
Sharing the player cards or any other stats is allowed, just make sure to give proper credit to the source. To make the charts smaller or remove data that you feel is irrelevant/not important, click on the parent category & hit the exclude button. I like doing this for defensemen, as the more important stats are usually at the bottom of their charts. I’ve also found that it’s easier to show parts of the data instead of the complete set, as things can get noisy if you present too much at once.
Future Additions
I’m always looking to make additions to the player cards (especially special teams data) but I’m still looking for the best method possible, so I’m open to any suggestions. With 40+ data points tracked per player, some things are going to get lost in the shuffle but if there’s anything missing that you want to see, please let me know!
